Allez au-delà des normes internationales avec des données 2D+3D précises et répétables — pour préserver vos infrastructures et éviter des réparations coûteuses.
Voir la fiche technique (Anglais)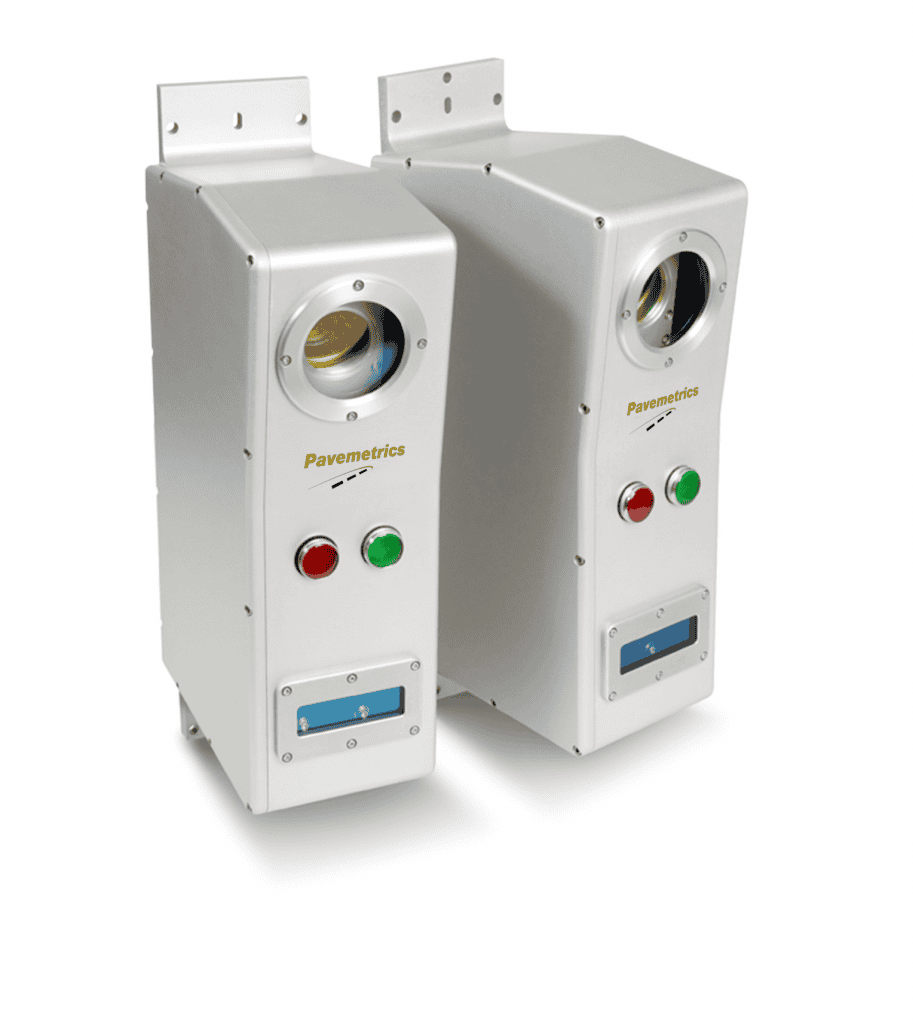
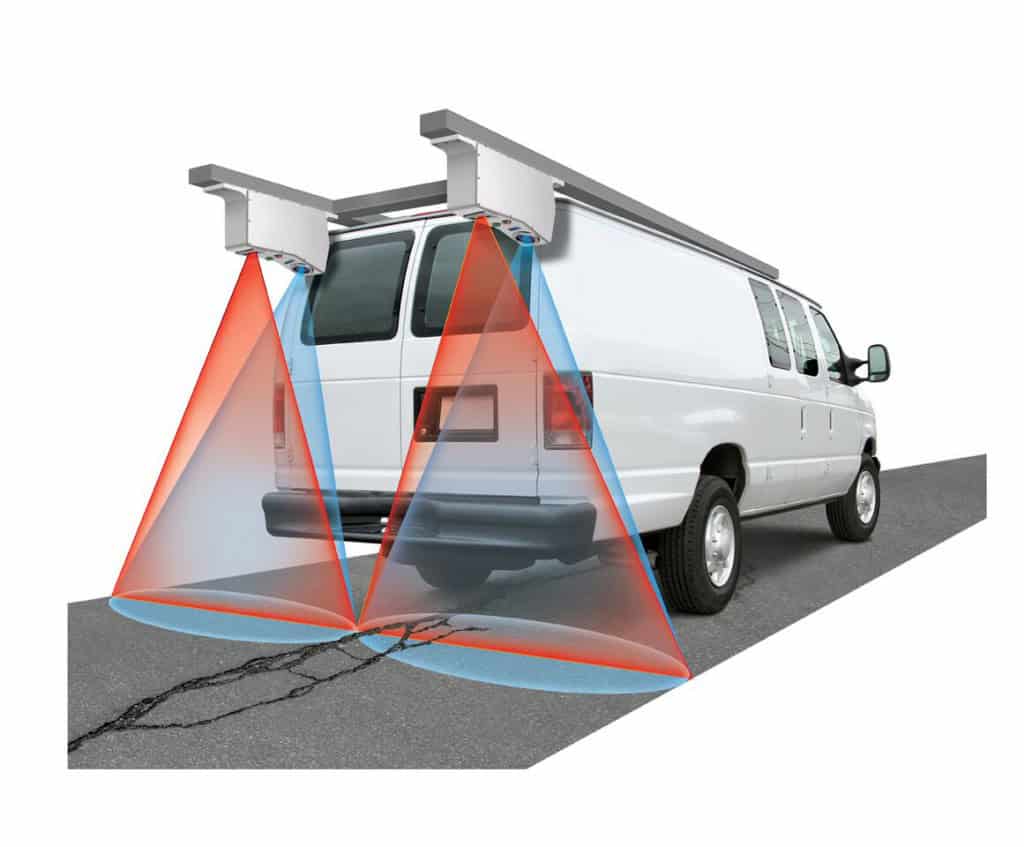
Inspections à vitesse d'autoroute (jusqu'à 120 km/h) en un seul passage, sans interruption de la circulation.
Des données proactives pour détecter les défauts précocement et maximiser la longévité des chaussées grâce à des mesures 3D et une imagerie haute résolution simultanées.
Des résultats reproductibles qui réduisent les reprises, les retards et les coûts inutiles, tout en optimisant les opérations de jour comme de nuit.
Des sorties cohérentes, géoréférencées automatiquement grâce aux données inertielles corrigées (x, y, z), sur lesquelles vous pouvez compter pour vos décisions critiques.
Optimisez vos ressources humaines, financières et matérielles grâce à des informations exploitables et à un système compact, robuste et écoénergétique.
Le Laser Crack Measurement System Pavemetrics® (LCMS®-2) est un système de vision 3D haute résolution qui automatise l'inspection des chaussées à vitesse de circulation. En un seul passage, le LCMS-2 géoréférence, mesure et quantifie tous les paramètres fonctionnels clés de la chaussée — y compris la fissuration, l'orniérage, les nids-de-poule, le ravèlement, le ressuage, le fluage, la texture et la rugosité — avec une précision inégalée.
Conçu pour les levés à l'échelle du réseau, le LCMS-2 capture toute la largeur de la voie à une résolution de 1 mm, offrant des données cohérentes et reproductibles qui respectent — et dépassent — les normes internationales les plus élevées. En révélant les premiers signes de détérioration, le LCMS-2 aide les organismes et prestataires de services à prolonger la durée de vie de leurs actifs, à prévenir les réparations coûteuses et à optimiser les budgets d'entretien.
Fort de performances éprouvées sur un plus grand nombre de types de surface que tout autre capteur — de l'asphalte à chaud et du gravillonnage aux chaussées poreuses, en passant par le béton standard ou rainuré — le LCMS-2 fournit des données fiables, partout où elles sont nécessaires.
Jusqu'à 100 km/h, de jour comme de nuit.
Résolution de 1 mm sur toute la largeur de la voie (4 m).
Précision éprouvée conforme aux standards ASTM/AASHTO.
Tous les principaux défauts de la chaussée détectés en un seul passage.
Données non propriétaires prêtes pour l'intégration aux systèmes de gestion de l'entretien (PMS).
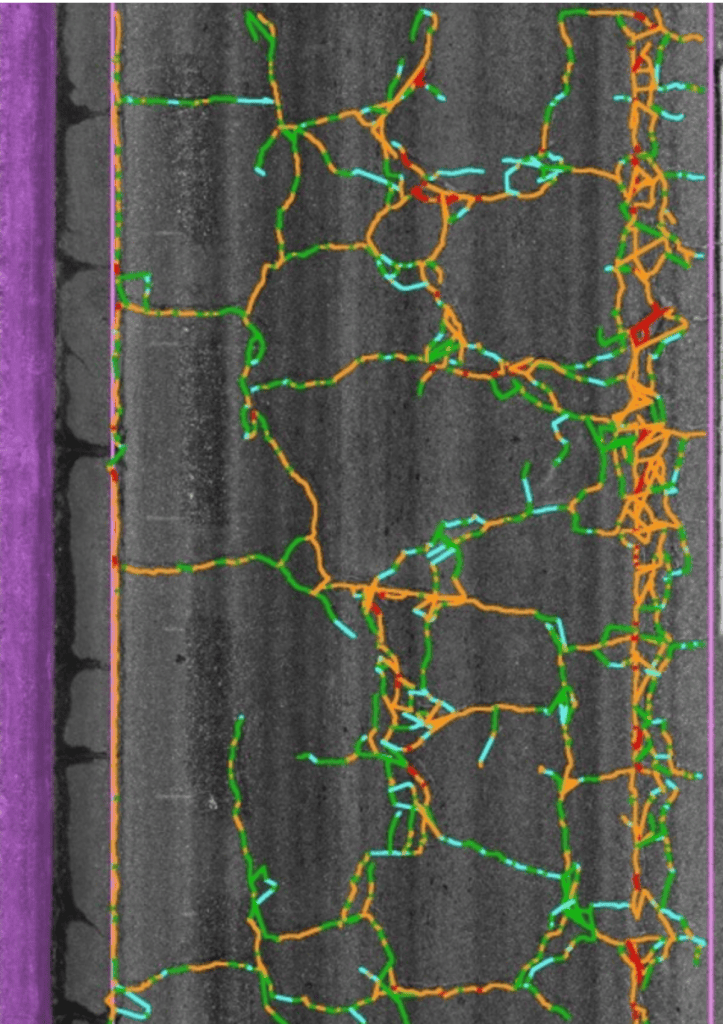
Fissuration et orniérage, nids-de-poule, réparations, ravèlement, ressuage, délamination, fluage, joints et dénivellation, marquages au sol, bouches d'égout et drains, bordures et accotements.
Découvrez toutes les capacités de mesure et plus de détails : Voir les capacités de mesure
Asphalte, gravillonnage, chaussées poreuses, béton
1 mm sur toute la largeur de la voie (4 m)
0 à plus de 100 km/h
Configuration à deux capteurs
XML, JPEG (géoréférencées), prêtes pour intégration aux systèmes PMS
Abstract: The assessment of the structural and functional pavement condition is nowadays a fully machine based non-destructive procedure in which equipment covers all the data input required for a modern PMS approach. A LCMS (Laser Crack Measurement System) is a high-resolution transverse profiling system based on 3D Sensors capable of real time continuous measurement of condition data in a single run. One of the images produced by a LCMS is the intensity image, which expresses the reflective properties of the pavement surface. As quality control of road marking often retro-reflectometers are used. A limitation of retro-reflectometers is that they can only measure for instance a single edge marking at any time whereas the road surface can have multiple markings. The LCMS captures the intensity of the surface over the total width of a lane and as such can measure the intensity of all road markings at any transverse location. This paper discusses the results of the correlation of the retro-reflectometer measurements with the intensity measured by the LCMS-2. This study resulted in a very promising correlation showing that the LCMS-2 collected data is very useful in rating the quality of road markings and predicting the need for maintenance.
Abstract: The Saskatchewan Ministry of Highways and Infrastructure (SMHI) adopted Laser Crack Measuring System (LCMS) technology for collecting road condition data in 2016. LCMS data has replaced a visual assessment method for identifying cracking and other surface distresses. This paper discusses the methodology used to determine type, severity, extent and aggregation of LCMS distress data. To better analyze the data, SMHI developed the Surface Condition Indicator (SCI) to support asset management decision making for setting performance measures, optimize budgets, and identify pavement preservation candidates.
Abstract: 135 billion euros is the estimated value of the French road network. This road network, one of the pillars of the French economy, induces significant maintenance costs, valued at 10 billion euros per year for all roads (excluding bridges and road structures). These ever-increasing road maintenance needs and the will to optimise its maintenance works in a long-term perspective led the French State to set up in 1992 an evaluation of its network, called IQRN for "Image Qualité du Réseau National" (National Network Quality Index). In 2015, in order to improve the relevance of the indicator, the French State asked Cerema to develop and produce the third generation of the IQRN methodology. In 2018, Cerema introduced the IQRN3D methodology. Based on Pavemetrics Laser Crack Measurement System (LCMS) sensors and an accurate GNSS localization system, Cerema has designed two new inspection vehicles called AIGLE 3D. To make the 35,000 km annual measurement campaign more reliable, we have implemented an optimized organization and significant improvements such as remote maintenance and a merged tool controlling all vehicles sensors.
Abstract: Those in the industry of managing roads are likely aware of trends towards using high-speed scanning lasers to collect pavement condition data. The most commonly recognized being Pavemetric's Laser Crack Measurement System (LCMS). These scanning lasers have been incorporated into survey systems by several manufacturers (e.g. ROMDAS) and are no longer exclusively used on road networks in Europe and Northern America, instead becoming more and more sort after in developing countries. While this trend might be known, the range of technological and practical benefits of using this equipment is less widely understood. Furthermore, it is also taking time for engineers and institutions to develop ways of utilizing the new dataset offered by LCMS and 3D profiling. Because LCMS outputs roughness, rut depth and other typical dataset; most engineers will simply format and apply these datasets to existing maintenance and planning templates. However, there is a wealth of additional information obtained by LCMS which could provide new benefits to engineers, both at a project and network level. This article is aimed at providing a clear, and somewhat simplified, overview of how LCMS records and then processes pavement condition. It will also try to highlight some of the unique advantages of this technology over traditional survey equipment, ending with a specific example from New Zealand on how a new dataset is being utilized at the project level.
Abstract: This article proposes a way to reuse the 3D road surface condition data to create road surface model and avoid expensive manual road surface surveys that require road closures. This new approach provides a way to tag collected high resolution high accuracy transverse road profile data acquired by a LCMS system (Laser Crack Measuring System – Pavemetrics) with a highly accurate GNSS-INS system (Applanix POS-LV – Trimble) to measure both road surface condition and to generate a survey grade accuracy terrain map of any road surface. The information provided by the 3D LCMS system, DMI, Applanix POS-LV, GPS with local RTK corrections and post processing (POSPac-Trimble) software are used to generate the road surface models with repeatable measurements and accuracy compared to surveyed control points. This process results in significant productivity improvements, optimization of the quantity of material that needs to be carried in and out, lower survey costs, decreased traffic interruptions and improved safety of surveyors while improving the quality and resolution of the road surface models.
Full article available in the PDF document.
Abstract: 3D transverse profiling techniques such as the LCMS (Laser Crack Measurement System) have proven reliable at detecting open cracks these systems have not been widely used to evaluate road texture. This article will present test results from the New Zealand Highway Authority (NZHA) that demonstrate that 3D transverse profiling lasers (LCMS) can be used to measure macro-texture as accurately as a single point texture lasers. Furthermore, because transverse profiling lasers measure texture on the entire road surface we will demonstrate that they can also be used to detect important surface features (sealed cracks, bleeding and raveling) that are missed by single point lasers.
Full article available in the PDF document.
Abstract: Advances in instrumentation have led to the development of new technologies that provide a number of options for collecting pavement condition data. Manual methods have been successfully replicated, automated and then further improved. For instance, 3D laser sensors were first introduced as a means of measuring the transverse profile of the pavement in much greater detail than a straight edge or even a multi-point laser profiler. However, with further advancements this technology is now being used to identify cracks and other defects in the pavement surface. This paper looks at how 3D technology can be used to measure pavement cracking as well as other pavement condition parameters that are of interest to state and local government agencies.
Full article available in the PDF document.
Abstract: For more than 25 years, RAMM surveys have been the backbone of maintenance planning on New Zealand (NZ) road networks. Using a 10% or 20% sampling method associated with a detail manual survey differs significantly with other parts of the world that opted mostly for a 100% windshield survey. During a recent NZTA research project the NZ visual survey methodology has been fully reviewed. One of the major recommendations of this report was that minimum sampling length should be increased to 20%. The report also concluded that for all the visual distress modes, cracking is by far the most important rated item. The remaining problem is that even with an increased sampling size, the variability and quality of survey outcomes are still much worse than what is required by current planning processes and trend monitoring. The reality is also that in the new performance based world of today, the repeatability and robustness of visual surveys are simply not good enough.
Abstract: Pavement condition surveys which identify pavement distress types, severities and quantities and provide a condition index or rating are an essential part of any pavement management system and an invaluable tool in the evaluation of a pavement's performance. Traditionally, distress data has been collected manually on foot, where the pavement is examined by eye, and the distress data is measured by hand. For airfield pavements, this often involves significant disruption to or closure of runways which can be very inconvenient and costly. Further modifications in Ireland have led to the development of more rapid visual inspection methods using a driven windshield survey procedure and more recently, using forward view digital video. This paper describes a case study where automated data collection and processing using Laser Crack Measurement System (LCMS) technology was used to establish and graphically report the pavement condition on two major runways at Dublin and Cork Airports, Ireland. The runways at both airports were constructed with asphalt-surfaced pavements. The data collection for the study included manual walking surveys, visual surveys from forward view digital video, and the collection of intensity and range three-dimensional (3D) imagery using an LCMS mounted on a high speed vehicle. The type, severity and extent of the pavement distress data were identified from the manual survey, the digital video, and using automated extraction from the LCMS 3D imagery. The data were processed and evaluated using the Micro PAVER pavement management system and the condition reported using the US Army Corps of Engineers Pavement Condition Index (PCI). The imagery and distress data from the LCMS survey were graphically reported using colour-coded thematics in ArcGIS and Google Earth GIS formats, and the detailed distress data was also mapped in AutoCAD layers. The paper examines and compares the pavement condition results obtained from the manual, video and LCMS data collection methods, and outlines the findings in using LCMS technology to automatically identify, geo-locate and graphically report pavement condition and distress data for airfield pavements.
Full article available in the PDF document.
Abstract: Faulting is one of the important performance measurements for jointed concrete pavements, as it has a direct impact on ride quality. Faulting has traditionally been measured manually using hand-held devices, such as the Georgia fault meter. However, manually measuring faulting on the roadways is labor intensive, time-consuming, and hazardous to workers and drivers. There is a need to develop alternative methods for effectively and safely collecting faulting data on each joint at highway speed. This paper proposes a new method to collect faulting data at highway speed using the 3D continuous pavement profile data acquired with emerging 3D laser technology and assesses its feasibility in field tests. While 3D continuous pavement profile data is initially used to detect asphalt pavement cracking and rutting, this paper further explores its use on concrete faulting measurement. Controlled field tests were conducted using artifacts with known elevation differences, and results show the proposed method can achieve desirable accuracy and repeatability with an absolute difference of less than 0.6 mm (0.024 inches) and a standard deviation of less than 0.4 mm (0.016 inches). Field tests were conducted on 15 joints on Interstate 16 (I-16) in Georgia, and preliminary results show that operating the proposed system at highway speeds (e.g. 100 km/hr) is feasible and has reasonable repeatability. Two tests have demonstrated the proposed method is very promising for providing an alternative solution to collect joint faulting data at highway speed. Recommendations for future research are also discussed.
Abstract: Raveling is one of the most common asphalt pavement distresses that occur on U.S. highway pavements. Raveling will increase pavement roughness, which results in poor ride quality and road and tire noise. Besides safety concerns, such as loose stones that may break windshield glass and can cause hydroplaning, raveling will also shorten pavement longevity. Thus, a raveling condition survey is required for highway agencies to determine the severity levels, the extents, and the locations of raveling so the preservation or rehabilitation treatments can be appropriately applied. However, the traditional raveling survey method, including determination of the raveling severity level (e.g., Low, Moderate, or High; or Severity Level 1, 2, or 3), extent, and location is a visual inspection that is time consuming, subjective, and hazardous to highway workers. Thus, there is an urgent need for developing an automatic survey method. Although some algorithms have been developed to detect and classify raveling, they are still at the very early research stage and the outcomes were often not acceptable. In addition, they have not been thoroughly validated using large-scale, real-world data. Therefore, it has been difficult for transportation agencies to implement any of such algorithms. To address the problems in existing raveling detection and classification methods, the objective of this study is to develop successful and effective raveling detection, classification, and measurement algorithms using three-dimensional (3D) pavement data and macro-texture analysis, and to comprehensively validate these methods using large-scale, real-world data.
Abstract: In order to maximize road maintenance funds and optimize the condition of road networks, pavement management systems need detailed and reliable data on the status of the road network. To date, reliable crack and raveling data has proven difficult and expensive to obtain. To solve this problem, over the last 10 years Pavemetrics inc. in collaboration with INO (National Optics Institute of Canada) and the MTQ (Ministère des Transports du Québec) have been developing and testing a new 3D technology called the LCMS (Laser Crack Measurement System). The LCMS system was tested on the network to evaluate the system's performance at the task of automatic detection and classification of cracks. The system was compared to manual results over 9000 km and found to be 95% correct in the general classification of cracks. IMUs (accelerometers and gyroscopes) were added to the LCMS 3D sensors. This has allowed the LCMS system to be used to also measure road geometry (longitudinal profile IRI, slope and cross-slope) with a very high degree of accuracy. Results and comparison tests with standard class 1 inertial profilers show that the LCMS matches and improves upon existing technology.
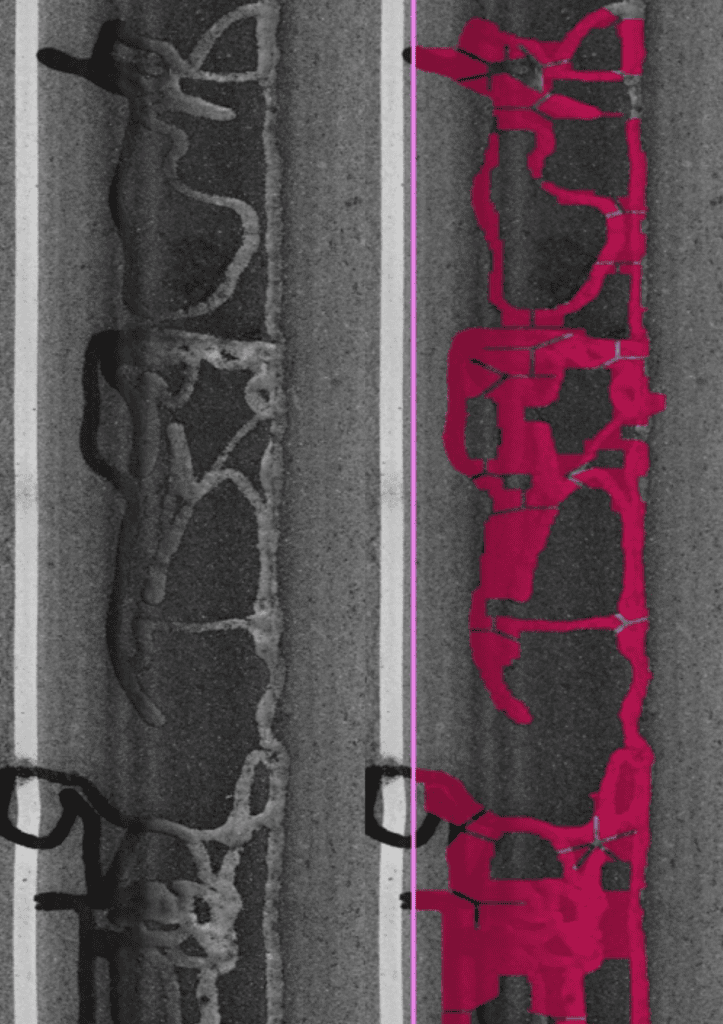
Abstract: Reliable cracking data has proven difficult and expensive to obtain using cameras and video systems because of the lack of good automated 2D image processing crack detection algorithms. To solve this problem, 3D technology such as the LCMS (Laser Crack Measurement System) has been used to obtain automated reliable and repeatable cracking data. The LCMS system has been widely used for automated crack detection on a variety of road surfaces (DGA, porous, chipseal, concrete) in over 35 different countries. While 3D techniques have proven reliable at detecting open cracks these systems have not been used for detecting sealed cracks. These sensors however also often produce intensity (2D) images that are used to detect lane markings. Using this intensity (2D) data for the automated detection of sealed cracks has also proven unreliable because sealed cracks can sometimes be darker or brighter than the surrounding pavement in the images and tire marks and other features can also cause false detections. This article will demonstrate that the accuracy of sealed crack detection can be improved by using both 2D intensity data and 3D texture information evaluated from the 3D data. To do this 3D texture evaluation algorithms are described and implemented in order to generate a complete texture map of the road surface. The intensity images are also processed in order to extract dark and light areas of the appropriate geometry (size and shape of sealed cracks). The combination of the results from both sets of processed data is then used to detect and validate the presence of sealed cracks.
Abstract: In order to maximize road maintenance funds and optimize the condition of road networks, pavement management systems need detailed and reliable data on the status of the road network. Over the last 10 years Pavemetrics Systems inc. in collaboration with INO (National Optics Institute of Canada) and the MTQ (Ministère des Transports du Québec) have been developing and testing a new 3D technology called the LCMS (Laser Crack Measurement System). This article presents the results obtained after analyzing the detailed 3D data collected in order to evaluate road surface texture. Results show that macro-texture can be evaluated over the entire road surface at the network level with accurate and repeatable results.
Abstract: An important characteristic of a pavement surface is texture. Texture does relate to friction, noise and ravelling and does change over time due to aging, contamination and loss of aggregate. As such it is an important characteristic triggering maintenance measures when it does not meet the requirements anymore. The standard procedure is to measure texture based on the Mean Profile Depth (MPD), which is a single point measurement along a longitudinal track sampled at a high frequency. The actual requirement is a volumetric 3D based result to be directly representative for the characteristics required without the need of a conversion from a 2D based test. This study was conducted to validate at traffic-speed measured MTD's using a Laser Crack Measurement System (LCMS) with the results of the static Sand Patch Test Method (SPTM). The LCMS does measure the volumetric properties of the road surface continuously over its full width and length based on 250 x 250mm squares. The evaluation did include static SPTM's, a static ELAtextur device measuring MPD and a traffic-speed road surface profiler equipped with a texture laser measuring MPD as well. The test were conducted over different time periods and multiple runs at a validation site used for calibrating testing equipment operating at roads in Singapore. This paper discusses the results of the equipment used and does show the very good correlation between the SPTM results and the MTD's based on the LCMS device. A major advantage is that no conversion is required as the volumetric MTD is a direct output. The LCMS based automated MTD analysis is a machine based result not influenced by a human factor such as the SPTM. The results allow as well the automated analysis of loss of aggregate which is a major advantage in rating the severity and extent of ravelling in comparison to the non-consistent wind-screen surveys and manual rating of collected images. However, the next generation LCMS sensors will require an improved vertical resolution to improve on the reliability of ravelling for finer textured surface courses.
Abstract: Most road agencies are willing to take advantage of new developments in automated data capture if it helps them to better manage their road networks. However, the acceptance process for new technologies can be a long and arduous task for service providers and equipment vendors with ultimate success often depending on how well the equipment can reproduce historical data or whether they meet existing test methods or standards. Road agencies in Australia are only just beginning to utilise 3D systems for monitoring their road network surveys and up until now they have been predominantly used for crack measurement. However, these systems are also capable of measuring a variety of other pavement condition indicators, one of which is road roughness. This paper investigates whether the roughness measurements made by a 3D system can meet the current requirements specified in the Australian test methods for measuring pavement roughness.
Explore Eddyfi Technologies product lines